Archive for the ‘Survey’ Category

Odors are not a pest in New York

November 8th, 2010 by Edouard de Mareschal

According to a survey, a majority of J-school students don’t consider odors as a pest of New York City. When asked, 73% of them said that odors are one of the most pleasant features of New York City. Even among those who answered the contrary, they were not more than 18% to consider that it should be considered as a public issue.

However, everybody already had a very bad experience with odor in NYC. According to the survey, garbage in the street and the metro are the places that smell the worst. They gathered both 45% of the students who answered. 10% answered that the street was the place that smelled the worst.

The 2010 Midterm Elections

November 8th, 2010 by Paul DeBenedetto

With the Republican Party gaining a majority in the House of Representatives and adding additional seats in the Senate, the 2010 midterm elections have changed the face of government.

Pundits from both sides of the political spectrum, liberal and conservative, speculated as to what the outcome of the elections would be. At times, the media narrative focused on the Tea Party, and Republican “outsider” candidates who would move into Washington and change the “status quo.” Other times the media chose to focus on Sarah Palin’s influence on the elections, having backed successful candidates in the Republican primaries, and gone on to campaign for other Republican candidates during the midterm.

Overall, the buzz word was “wave”; as in, a wave of Republicans taking seats from the Democrats.

I asked people what they thought of the midterm elections.

(A note on sample size: conservatives were not as well represented in my polling as I would have liked, so I thought it best to separate the data by liberals and conservatives. However, polling will continue, and I’d love a larger sample size, so if you haven’t taken the survey, or know someone who would be interested, click here to visit the poll!)

(more…)

I Feel Safe, Say CUNY J-Schoolers

November 8th, 2010 by Jacqueline Vergara Amézquita

Life in New York City offers a long list of annoyances to the city dweller. Metro fare hikes, disoriented tourists who block the flow of city streets, and the recent bed bug scare are some of the issues the CUNY J-school Class of 2011 notes as most cumbersome.

But as the irritating aspects of life in this metropolis are discussed, a popular urban topic is generally left out: crime and safety.

So I set out to find out if my classmates at J-School worry about crime and if they feel safe in their neighborhoods.

Of the 12 students who responded to the online survey about safety and crime in their borough, 58% were female and 42% were male.

Only three of the five NYC boroughs were represented, with 67% living in Manhattan, 25% in Queens, and 8% in Brooklyn.

Asked whether they feel safe walking alone in their neighborhood late at night (after 10 p.m.), 50% said they “always” feel safe, and 50% said they feel safe “most of the time.” No one checked the “sometimes,” “rarely”, or “never” options.

When asked if they knew someone who has been a victim of crime in the borough they (respondents) live, 25% said “yes.” However, 100% said they have never been a victim of crime in their borough, which may explain why none reported feeling at risk for crime there.

After all reported feeling safe in their borough, I was not surprised to learn that most do not keep track of crime in their borough: 75%.

Perhaps the New York Police Department’s report of the annual decrease in crime levels over the past 20 years has helped?

The Press as Pest?

November 8th, 2010 by Stuart White

By Stuart White

One of the chief ironies of being a journalist reporting on pests is that in the eyes of many people, the press is itself a pest.  In the course of reporting on obnoxious bar behavior for an earlier post, one bartender answered this reporter’s question about the most obnoxious thing he’d seen in the bar with, “You, buddy.  You take the cake.”

Granted, the question came in the middle of a field goal attempt in which the gentleman seemed highly invested, but the encounter and others like it underscore an important truth: the public doesn’t much care for the old Fourth Estate.

In the wake of the midterm elections, the time seemed right to send out a survey checking up on people’s faith in the press, specifically it’s ability to report fairly on politics.  The results, somewhat surprisingly, weren’t as grim as one might imagine.

In general, the survey’s respondents were very media-savvy.  Only three of the 35 said they didn’t follow the news, and all but eight reported getting their news from multiple sources.

Despite recent dire studies, about 71% of the survey’s 35 respondents ranked their trust of the media as a four or five on a five-point scale.  One respondent, whose trust of the media only warranted a three, drew a distinction between print and television media outlets.

“If by mainstream, we’re talking about NYT, WSJ, WaPo and print pubs in general, I definitely ‘trust’ them,” said the respondent.  “It’s not that I don’t distrust cable news as much as I find it ineffective at best, and biased at worst. I don’t find it misleading, however.”

According to the respondent, much of the responsibility falls to the audience.  “Every news consumer should take ownership of what they read/watch and understand the outlet’s context,” they said.

However, despite the sample’s overall trust of the media, only one respondent described the media’s coverage of politics as “just right.”  The remainder described the media as “too biased” (41%), “too trivial” (26%), “too impulsive” (24%), or “too pervasive” (9%).

These concerns existed on both sides of the political aisle.  Of the sample’s four self-identified conservative voters, concerns about media bias, impulsiveness and triviality mirrored that of the rest of the respondents’.

One conservative respondent even saw media bias as having a direct impact on the electoral process, saying, “It absolutely changes the minds of voters.”  Another respondent called the media “purposefully polarizing.”

While respondents expressed a variety of views, the consensus seemed to be that the media tends to focus on political extremes rather than measured debate, and despite the group’s overall trust of the media, most of the respondents’ comments were tempered with criticism.

What’s the peskiest aspect of the media?  One respondent put it best, saying, “I think the debate is important, but it’s that ‘one step beyond’ factor that starts to aggravate.”
J-School Classes; Where Do They Rank?

November 8th, 2010 by Daniel Prendergast

Now that the class of 2011 is halfway through it’s first semester, it’s safe to assume that everyone is fully acclimated to the program. We have all felt the pressure of daybook assignments and writing about something we only started researching the previous night. We have all lugged around a camera and tripod on the subway, only to return home with an aching neck and back. We have all sat in front of a blank computer screen trying to think of a new pest to blog about as the deadline draws near. And we have all sat through the tediously insipid lectures of legal precedents and case studies.

The class of 2011 knows the deal.

In a recent survey, students were asked about their favorite and least favorite classes here at the J-school and the results provide a pretty clear indication of where students are focusing their efforts and where they should maybe focus more effort. Craft and Interactive seem to be the classes that have captured student’s interest. Those two classes split 78% of the responses for student’s favorite. Not surprisingly, however, Legal/Ethics is no one’s favorite class and failed to gain even a single vote. That class did win outright in the area of people’s least favorite; taking 75% of the vote. Students were definitely sure which class they spend the most time working on with 86% voting for Craft.

What is your Gender?
Male 11 39%
Female 17 61%
What is your favorite class?
Interactive 9 32%
Broadcast 6 21%
Craft 13 46%
Legal/Ethics 0 0%
What is your least favorite class?
Interactive 3 11%
Broadcast 2 7%
Craft 2 7%
Legal/Ethics 21 75%
What class takes up the majority of your time?
Interactive 0 0%
Broadcast 4 14%
Craft 24 86%
Legal/Ethics 0 0%

8 out 10 Active Runners Will Suffer Injury in Their Career

November 8th, 2010 by Geoffrey Decker

If the highly-acclaimed British Journal of Sports Medicine and my little old informal – and wholly unscientific – survey are an indication,  runners hoping to remain injury-free face pretty stiff odds.

You heard that right. I put my research methods in the same sentence as the British Journal of Sports Medicine. Why? In a story about red flags that runners raise for health insurers, the New York Times cited one of their studies that “found rates of injury to the lower extremities were as high as 79 percent in long-distance runners.” (more…)

Can You Hear Me Now?

November 8th, 2010 by Brooks Newkirk

by Brooks Newkirk

“What’s the point of having a cell phone if it doesn’t work,” said frustrated cell phone owner, Kendra Adams. “It’s so annoying when I’m on the phone and a call drops or the connection is bad.”

Adam’s point is one shared by many frustrated cell phone owners. J.D. Power and Associates recently released a study that found increased incidences of dropped calls are causing people to switch cell phone providers.

Although cell phone companies like AT&T, Sprint, Verizon and T-Mobile boast about their extensive coverage area, how good are they really? Are customers who currently subscribe to their services happy? Do they plan on switching to another provider?

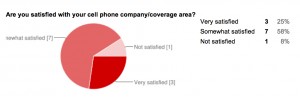
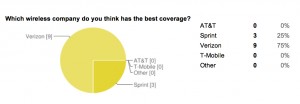
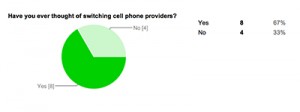
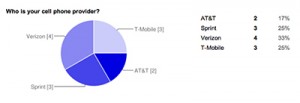
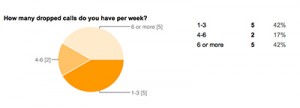
I hit the streets of New Yorker and asked 12 cell phone users their opinions of their current provider. Click on the images below to see the results:

The majority of the people I surveyed seemed somewhat satisfied with their cell phone providers, although they have considered ditching their current provider for a new one. Also both Verizon and non-Verizon customers said the wireless company had the best coverage area.

Coffee Drinkers … Anonymous

November 7th, 2010 by Kahliah Laney

One annoying side effect of being a budding journalist at the CUNY Graduate School of Journalism is sleep deprivation. To combat the bleary-eyed blues we are consuming copious amounts of coffee. The coffee machine has even broken down a couple of times from being overworked. But just how much coffee are we drinking?

After conducting a survey on a whopping nine anonymous classmates, I found out a few things. For one thing, it seems, that they are all drinking coffee even if in small amounts. On average, students drank 2.62 cups per person, per day but the number of ounces ingested in total ranged from 40 to six. On average, however, students consumed 17 ounces per day.

It also seemed that the men, who averaged less sleep drank more coffee than women. Men, on average, got 5.75 hours per night in comparison to six hours for women. The average cups drunk per day for males was 3.25 compared to two cups per day on average for women. Overall, however, J-Schoolers drank less than the overall U.S. average consumption of coffee, which, according to the 2010 Harvard School of Public Health, is 3.1 nine-ounce cups of coffee per day.

I also found that the average age of participants was 27.37 years and participants ranged in age from 35 to 23 years of age. The average age of male participants was 25.25 years of age and 29.5 years was the average age of the female participants.

There is some good news however. Also reported by the Harvard School of Public Health is the indication that coffee drinkers may be at less risk for type two diabetes and Parkinson’s disease. These benefits might just be incentive to keep on drinkin’ – coffee that is.


New Yorkers vs. Noise

November 7th, 2010 by Tuan Thanh Nguyen

By Tuan Nguyen

An international conference held late last month at The New York Academy found that, in many parts of Manhattan, people were exposed to decibel levels of over 70 decibels, which would create hearing damages over time. Besides hearing loss, daily exposure to these types of levels can lead to stress, heart disease and sleep disruption.

I put up a survey among friends of J-school, Facebook and other work contacts that I know here in New York to find out about their awareness of the issue as well as their solutions to the problems. After three days from Nov 4-7, the survey received 32 responses. Follows are what I’ve found so far:

  • Just as indicated by the report at the conference, the majority of the respondents (56,25%) are unaware of the risk.
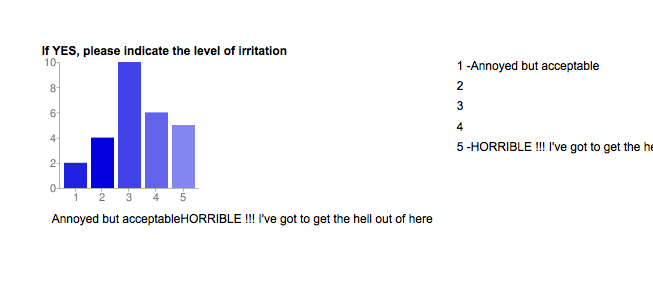
  • In terms of irritation level (from 1-5), inclination towards the higher end of irritation is much higher (graph attached).


  • Irritated as they are, most of the respondents (26 out of 32) said they would prefer to stay in Manhattan rather than to move out or change working place. The glamorous, jewel-like traits of the borough still bite.
  • Of the four noisiest places (Times Square, First Avenue above 14th Street, Broadway in Inwood and the Upper East Side), Times Square stands out as the noisiest. With regards to sources of noise, subway and car honking trump.

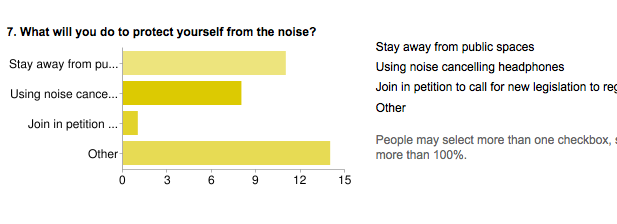
  • To deal with the problem, most of the respondents prefer either noise-cancelling headphones or staying away from the public spaces. Many of “Others” respondents include both of the choices.

    You can have a look at the detailed report here.